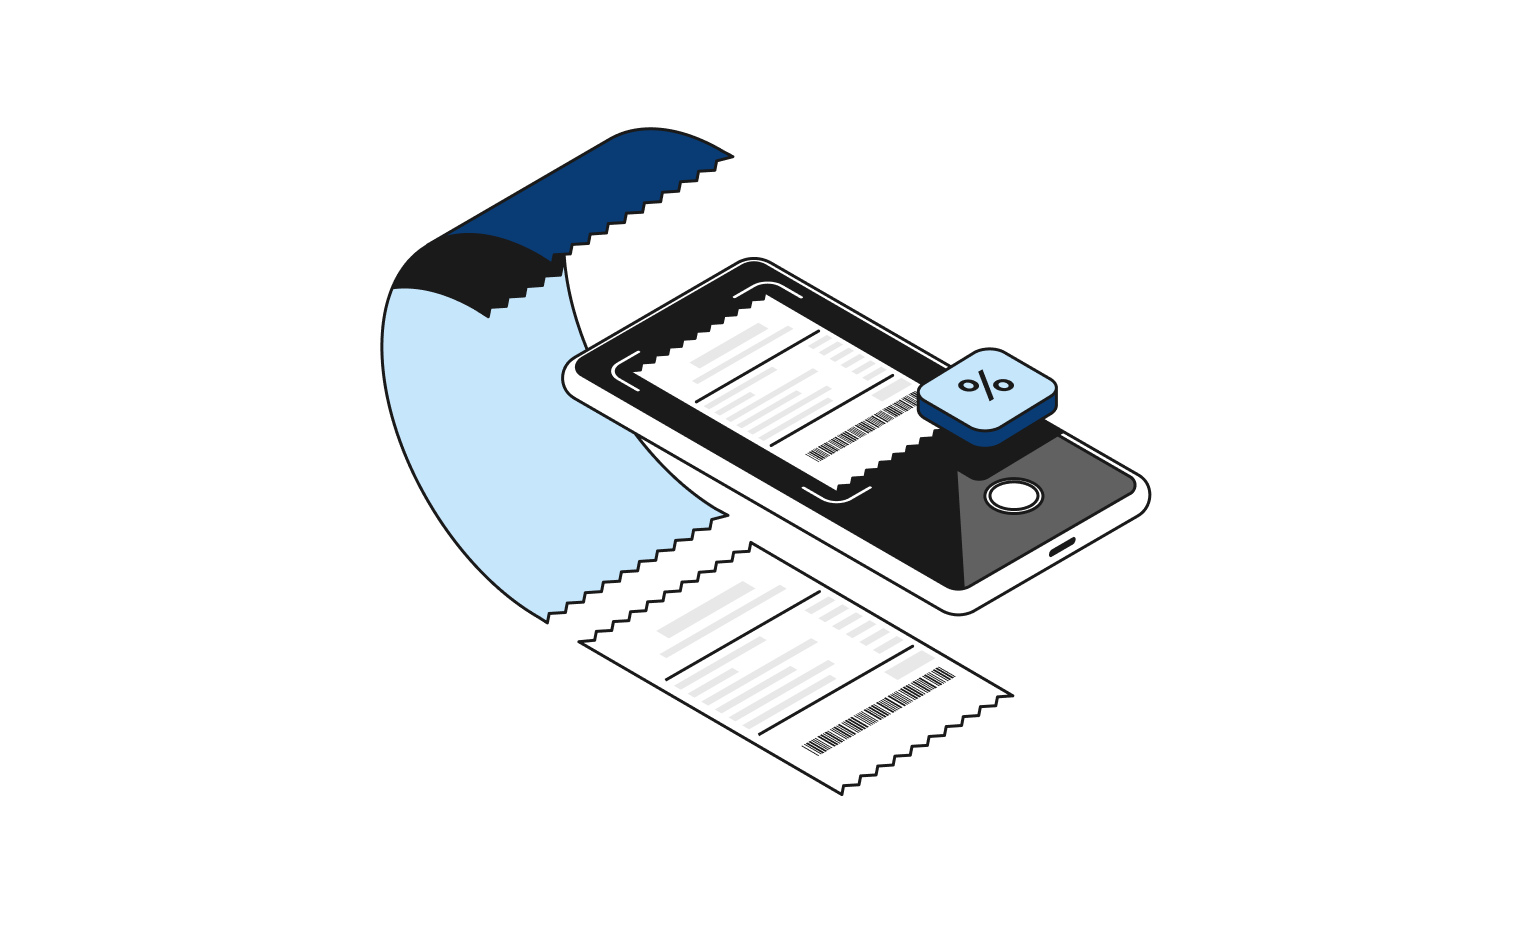
Like all the best Business Intelligence tools, Qonto gathers all your financial data in one single platform. Use our reporting features to inform your business decisions and boost your company’s growth.
“The dashboard is intuitive and lets me see my cash flow in real time.”
Hugo Chambon
Founder of Movecool
2 of 2
“I use the dashboard to follow my cash flow, to break down my financial flows according to each spending category and to manage my business proactively.”
Anaëlle Gautier
Freelance copywriter
Find out more about reporting tools
Reporting is one of the main sources of performance data that companies use to inform their decision-making. Generally, reporting takes the form of dashboard reports that rely on Key Performance Indicators.
Reporting tools simplify the process of creating dashboard reports by automating the collection of data and the creation of reports according to the criteria you set. This way, you can focus solely on analyzing the reports to assess the achievement of goals and guide your strategy.
Each company relies on different types of reporting to guide its decision-making. Here are the most common types:
Financial Reporting
Financial reporting is probably the most well-known tool, even amongst beginners. It seeks to analyze the performance and evaluate the financial situation of the company.
In addition to helping the management team make strategic decisions, it is also particularly appreciated by investors.
Commercial Reporting
Commercial reporting is another widespread decision-guiding tool. It involves creating a report on the company's commercial activity (turnover, margins, etc.).
These dashboards provide the key information managers need when formulating long-term commercial strategy. For example, whether to prioritize the production of one product over another to generate more profits.
Human Resources Reporting
HR reporting helps managers make decisions that directly affect employees. It can include creating dashboards to better evaluate staff turnover or payroll size.
This reporting also includes analyses of the professional skills of your employees, as well as social reports.
Marketing Reporting
Marketing reporting is used to measure the impact of a company’s marketing activity (campaigns, lead generation, etc.).
Its role is to give decision-makers better visibility by providing an overview of data collated from external reporting tools such as:
Google Ads
Google Analytics
Google Data Studio
Based on your performance indicators, the dashboard is an excellent tool for the efficient management of your business. In fact, reporting dashboards provide enable you to quickly compare any disparity between the defined goals and actual data. For example, you can see if your costs remain aligned with your expense forecast.
In this way, the dashboard is a managers’ ally when it comes to decision-making, as it pushes them to think about the measures to be implemented to improve performance and address any weaknesses.
A dashboard is much more easily readable than reports spanning dozens of pages. Its synthetic presentation, complete with graphics or diagrams, allows for quick visualization of priority decisions.
Here’s how you can create a financial report with Excel:
1. First, define the objective of your report so you can select performance indicators that are relevant to your project. 2. Retrieve the necessary data to create your dashboard in Excel. To reduce margin of error, you can use automatic data extraction. 3. Prepare and analyze the data. This step is a basic but important element of reporting; poor data preparation will distort the conclusions of your analysis. 4. Format your report in Excel to share the results of the data analysis with the end-user. You can use colors to emphasize important points, as well as diagrams and graphs to make your dashboard attractive.
Despite the growing availability of business intelligence software, also called BI tools, Excel remains one of the most widely used reporting tools for analyzing data and creating dashboards.
Preparing reports and dashboards to analyze your company’s performance involves the collection and interpretation of a large amount of data.
Reporting tools have many benefits:
Saving time
Limiting the risk of errors
Having data in real time
Automating processes
Verifying the effectiveness of implemented strategies
A reporting tool is a true collaborative resource for a company; gathering all pertinent data on a single platform facilitates internal communication.
Microsoft Power BI, Zoho Analytics, Pentaho Business Analytics, EMASphere, and MyReport are among the most popular business intelligence software available on the market.
Here’s what you should consider when choosing the most suitable tool for your company:
Evaluate the features offered by the BI tool
Not all companies need a complete reporting tool. In short, the most suitable software will be one that meets both your current and future needs. Generally speaking, 20% of its features will be specific to your company and its activity.
Don’t overlook certain important features, such as creating reports with custom fields or adding your brand image. This way, you can easily prepare reports for investors or other companies in your industry.
Try them out to see which ones are easiest to use
For the best results and, by extension, the wisest decisions, your software must have an intuitive interface that’s simple to use. This way, the team responsible for data collection and analysis spends less time preparing dashboards.
Also, consider the training users will need to be able to use the tool quickly and autonomously.
Compare the cost of different business intelligence software
As with any business decision, price is a key consideration and the most suitable software must respect your budget.
Here are the prices of the main BI tools:
€8.40 per month and per user for the Pro version of Microsoft Power BI. This option has many features such as dashboards and shared reports;
€22 per month for 2 users with the Basic offer of Zoho Analytics. This version allows you to generate unlimited dashboards and reports and synchronizes your data daily;
Prices on demand only for Pentaho Business Analytics and EMASphere.
Note that the price of the MyReport software is also available on demand. It includes the cost of the license, the deployment costs of the tool and the training of users.
Check the level of security of reporting tools
Your company's data is very sensitive and confidential information. Therefore, you must choose a reporting software that understands the cybersecurity issues related to your data.
Choose a solution that has protection against cyberattacks and that complies with the regulations in force regarding data management.